Get Grafana in Docker on Raspberry Pi and Share Compelling Visualizations
Story-Telling With Grafana Create Dashboards With Interactive Visualizations
Building Machine Learning or AI models is just the beginning. Conveying the insights derived from these models is equally, if not more, important. Interactive visualizations are powerful tools for gaining buy-in and influencing decisions. However, creating effective visualizations can often require as much effort as the modeling itself.
Use Grafana in Docker on Raspberry Pi
Grafana offers a low-code or no-code solution for creating dashboards. By connecting queries to your data backend, you can quickly develop visualization templates with live data feeds. Grafana enables you to generate compelling visualizations and craft a narrative that supports your recommended actions. For example, you can use gauges to track monthly spending against a budget and recommend cost-saving measures like eating in instead of dining out.
Installation Setting up Grafana in Docker
ollow these steps to set up Grafana on your Raspberry Pi:
- Pull the Docker Image:
docker pull grafana/grafana - Create Folders for Persistence: grafana/data and grafana/provisioning;
- Grant Access to Grafana User:
chown 472:472 /path/to/grafana/data. - Run the Docker Container:
	docker run --name grafana_service \
	--restart always \
	-d -p 3000:3000 \
	-v /path/to/grafana/data:/var/lib/grafana \
	-v /path/to/grafana/provisioning:/etc/grafana/provisioning \
	-e GF_SECURITY_ADMIN_USER=admin \
	-e GF_SECURITY_ADMIN_PASSWORD=topsecretphrase \
	grafana/grafana
his command creates a Docker container named grafana_service with persistent data storage in shared volumes and sets up an admin account.
- Launch Grafana: http://localhost:3000
Sharing Generate a Shareable Link
To share your Grafana dashboards:
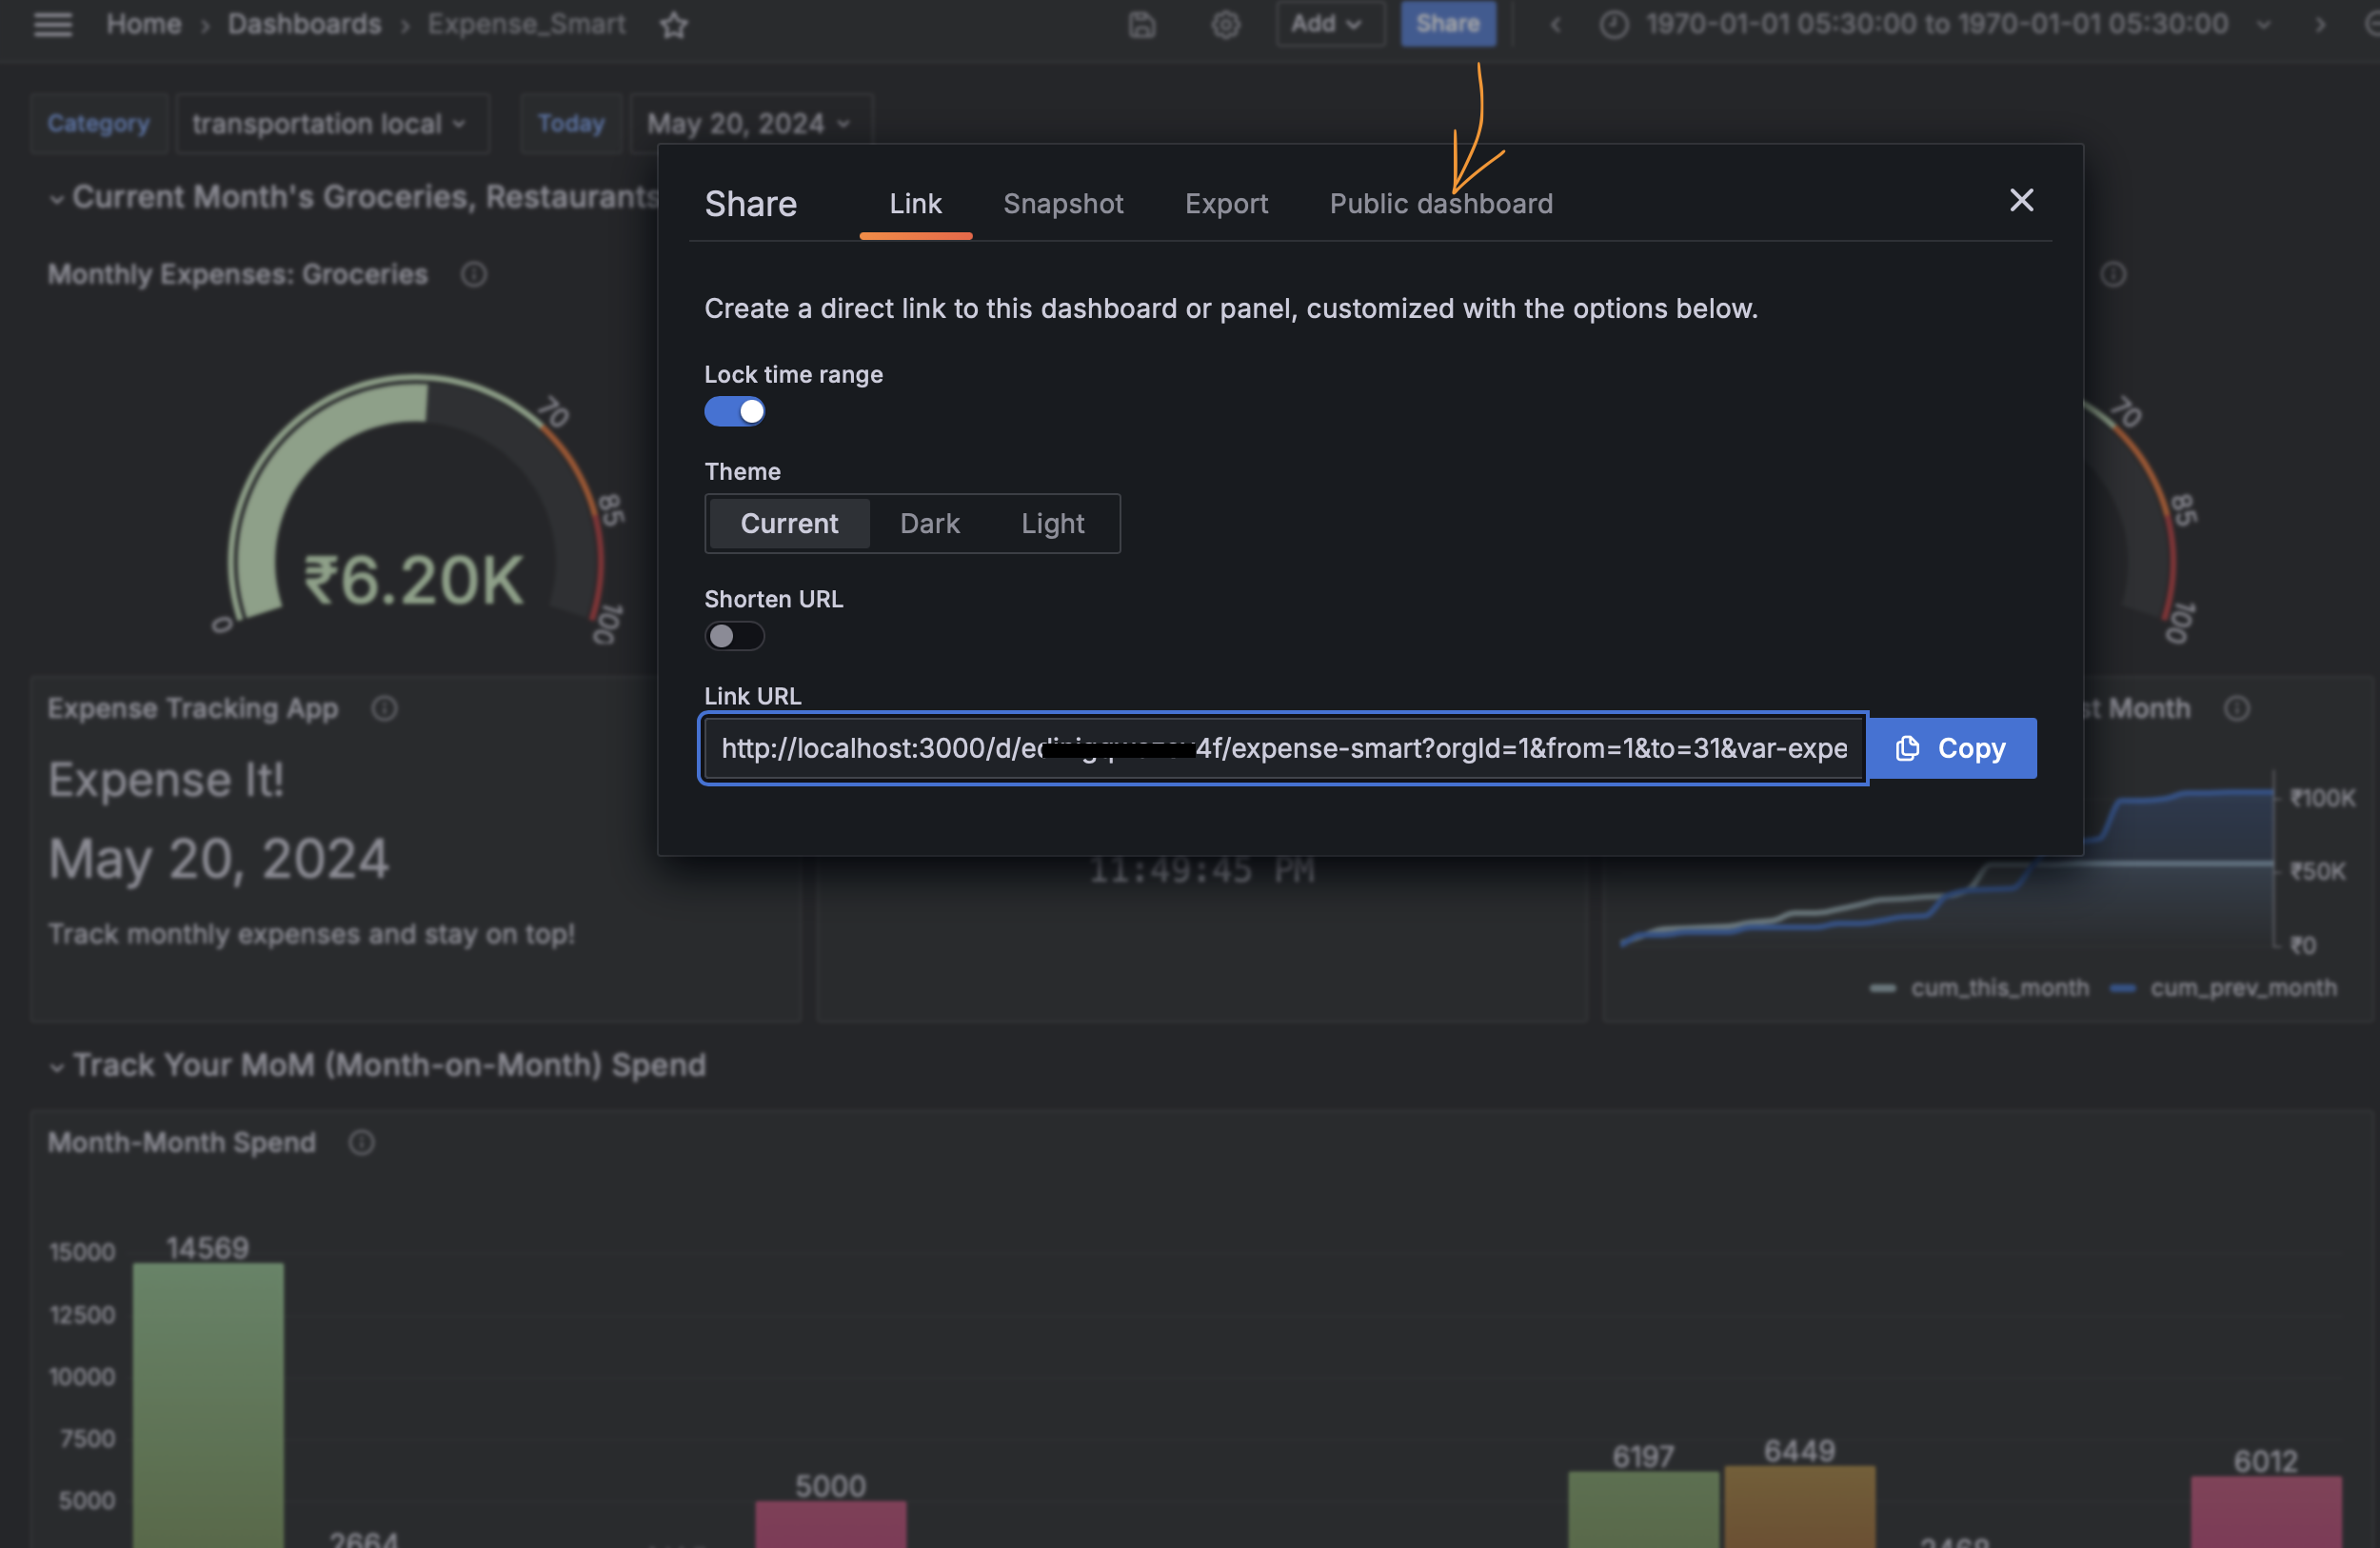
- Generate a Shareable Link: Click on the blue button labeled “SHARE” to obtain a URL for sharing. Recent versions of Grafana also allow you to create a public URL.
- Update the URL for Intranet Sharing: The generated URL will contain ‘localhost’. Replace ‘localhost’ with the IP address of the host machine to share the dashboard on your local network. Use a free IP scanner like LanScan (for Mac) to find the IP address of machines on your intranet.
By following these steps, you can effectively share your Grafana dashboards, ensuring that your visualizations reach your intended audience.
With Grafana and Docker, setting up and sharing interactive visualizations on your Raspberry Pi has never been easier. Use these tools to create compelling dashboards that effectively communicate your data insights.
Join our FastAI class to master not only the art of building robust AI models but also the essential skills of visualizing results and deploying software seamlessly into the hands of customers. Our course, led by experienced Ph.D. instructors, covers the full spectrum of AI development—from crafting accurate models to creating interactive visualizations with tools like Grafana and managing deployments using Docker on platforms like Raspberry Pi. Gain the comprehensive expertise needed to turn data into actionable insights and deliver real-world applications efficiently.


